
How is performance calculated?
KB: 0018
Info
Please be informed that this feature is unavailable at the moment. 
Performance allows you to track your P&L and trade volume chart over time(last hour/last day/last week) for each liquidity campaign that you participate in.
The following screenshot displays the performance summary.
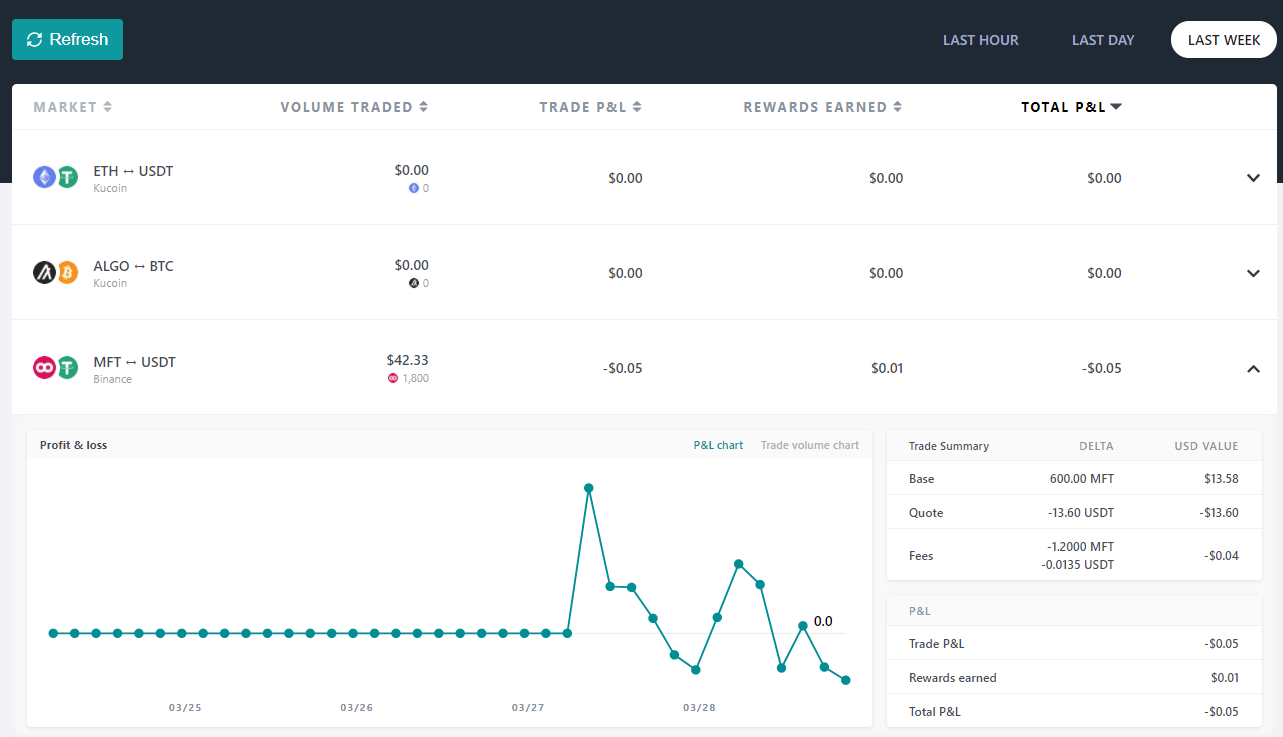
- Click (last hour/last day/last week) for the desired duration.
- Click desired market pair from the list. The chart, trade summary, and P&L table will display the statistics.
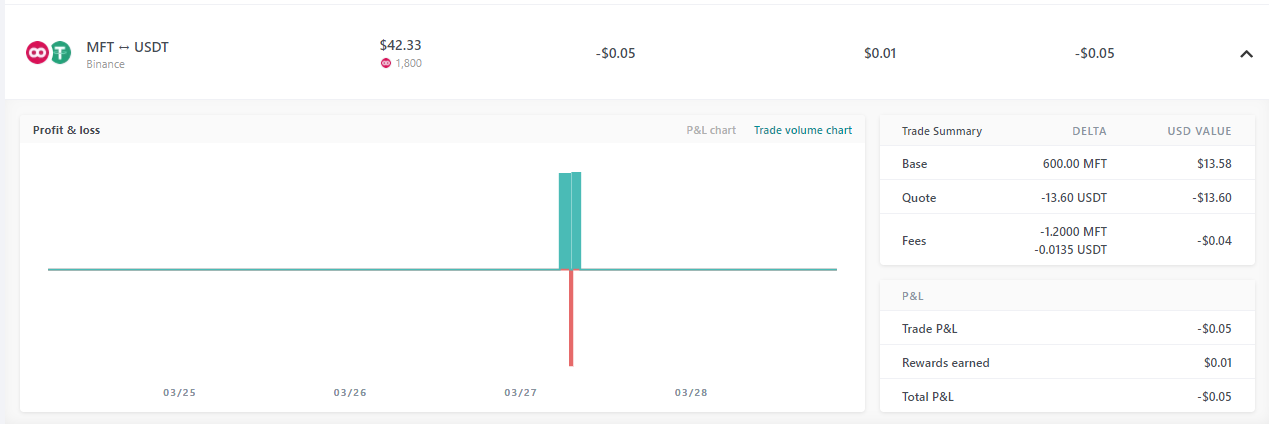
- Click the Trade volume chart, the volume of trades that were filled/executed over the duration(last hour/last day/last week) will be displayed.
How is performance calculated?
Trading P&L = base_asset_trade_delta * base_asset_usd_exchange_rate (at the end of query period) + quote_asset_trade_delta *quote_asset_usd_exchange_rate (at the end of query period) - sum (fee_amount * fee_asset_usd_exchange_rate (at time of transaction)) for each trade.
Total P&L = trading_p&l + sum(liquidity_mining_rewards * (at the end of query period))